Sensitivity analysis of GiveWell's cost-effectiveness analysis
Visual (scatter plot) and delta moment-independent sensitivity analysis on GiveWell’s cost-effectiveness models show which input parameters the cost-effectiveness estimates are most sensitive to. Preliminary results (given our input uncertainty) show that some input parameters are much more influential on the final cost-effectiveness estimates for each charity than others.
Contents
Last time we introduced GiveWell’s cost-effectiveness analysis which uses a spreadsheet model to take point estimates of uncertain input parameters to point estimates of uncertain results. We adjusted this approach to take probability distributions on the input parameters and in exchange got probability distributions on the resulting cost-effectiveness estimates. But this machinery lets us do more. Now that we’ve completed an uncertainty analysis, we can move on to sensitivity analysis.
Sensitivity analysis
The basic idea of sensitivity analysis is, when working with uncertain values, to see which input values most affect the output when they vary. For example, if you have the equation \(f(a, b) = 2^a + b\) and each of \(a\) and \(b\) varies uniformly over the range from 5 to 10, \(f(a, b)\) is much more sensitive to \(a\) then \(b\). A sensitivity analysis is practically useful in that it can offer you guidance as to which parameters in your model it would be most useful to investigate further (i.e. to narrow their uncertainty).
Visual sensitivity analysis
The first kind of sensitivity analysis we’ll run is just to look at scatter plots comparing each input parameter to the final cost-effectiveness estimates. We can imagine these scatter plots as the result of running the following procedure many times1: sample a single value from the probability distribution for each input parameter and run the calculation on these values to determine a result value. If we repeat this procedure enough times, it starts to approximate the true values of the probability distributions.
(One nice feature of this sort of analysis is that we see how the output depends on a particular input even in the face of variations in all the other inputs—we don’t hold everything else constant. In other words, this is a global sensitivity analysis.)
(Caveat: We are again pretending that we are equally uncertain about each input parameter and the results reflect this limitation. To see the analysis result for different input uncertainties, edit and run the Jupyter notebook.)
Direct cash transfers
GiveDirectly
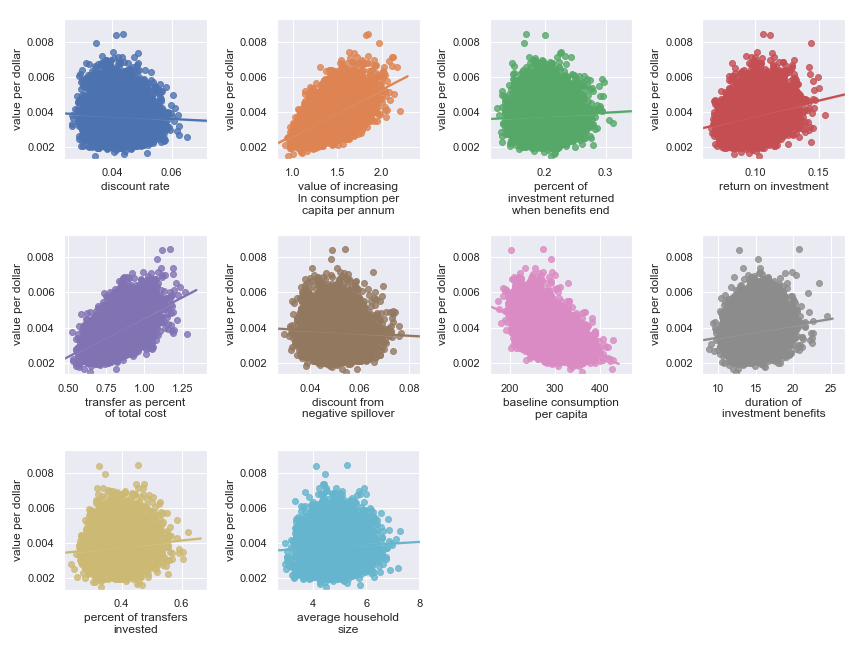
The scatter plots show that, given our choice of input uncertainty, the output is most sensitive (i.e. the scatter plot for these parameters shows the greatest directionality) to the input parameters:
| Input | Type of uncertainty | Meaning/importance |
|---|---|---|
| value of increasing ln consumption per capita per annum | Moral | Determines final conversion between empirical outcomes and value |
| transfer as percent of total cost | Operational | Determines cost of results |
| return on investment | Opportunities available to recipients | Determines stream of consumption over time |
| baseline consumption per capita | Empirical | Diminishing marginal returns to consumption mean that baseline consumption matters |
Deworming
Some useful and non-obvious context for the following is that the primary putative benefit of deworming is increased income later in life.
The END Fund
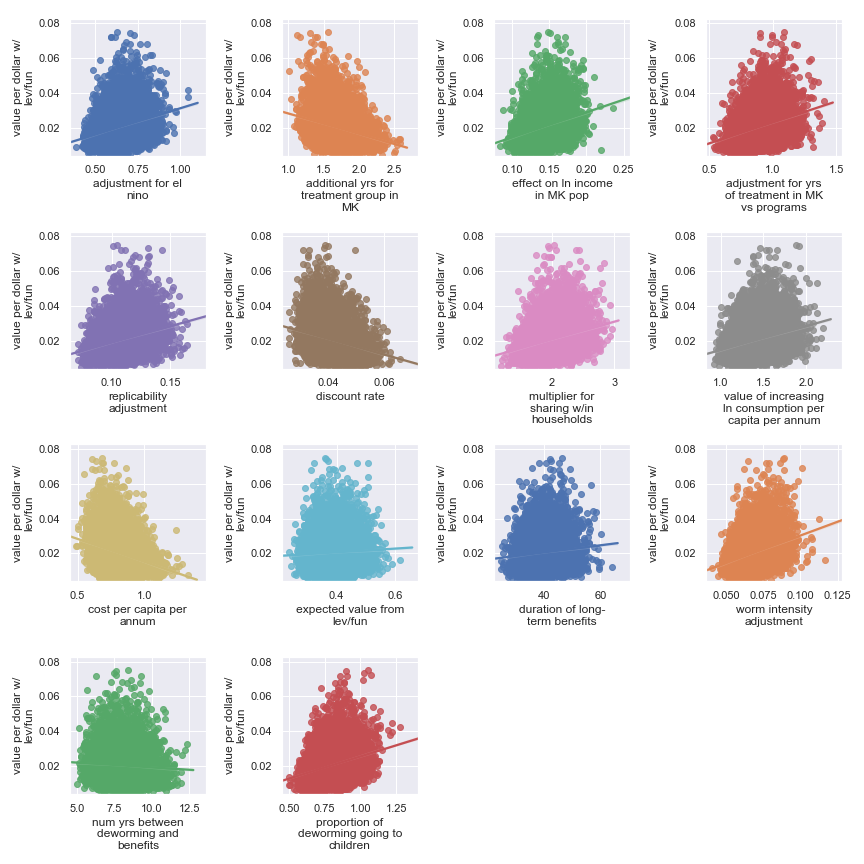
Here, it’s a little harder to identify certain factors as more important. It seems that the final estimate is (given our input uncertainty) the result of many factors of medium effect. It does seem plausible that the output is somewhat less sensitive to these factors:
| Input | Type of uncertainty | Meaning/(un)importance |
|---|---|---|
| num yrs between deworming and benefits | Forecast | Affects how much discounting of future income streams must be done |
| duration of long-term benefits | Forecast | The length of time for a which a person works and earns income |
| expected value from leverage and funging | Game theoretic | How much does money donated to the END Fund shift around other money |
Deworm the World
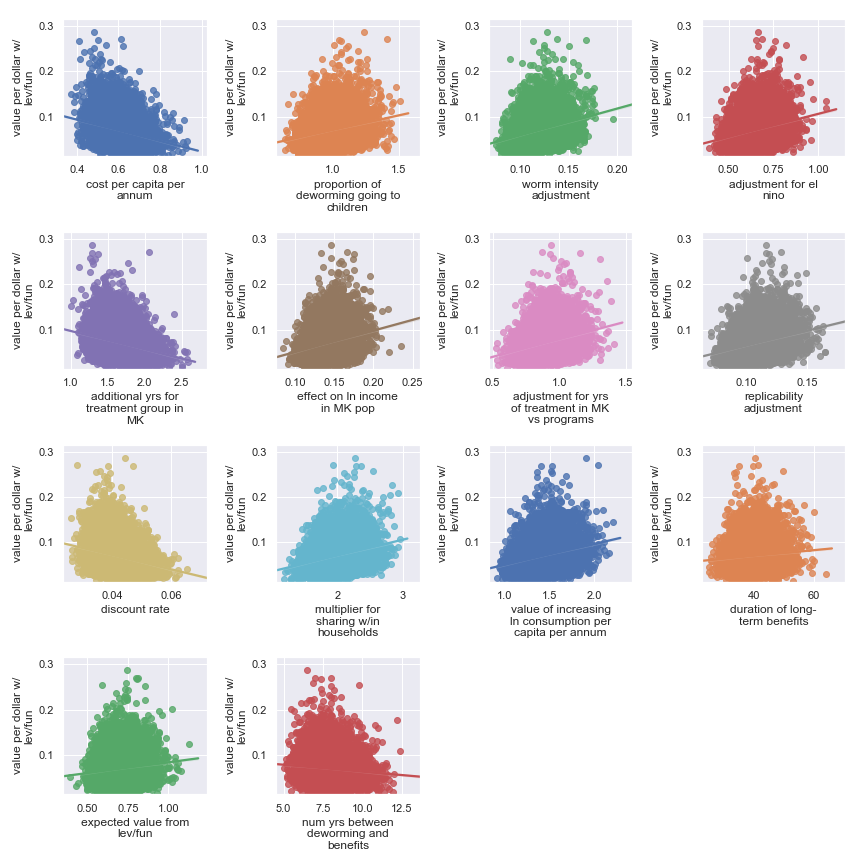
Again, it’s a little harder to identify certain factors as more important. It seems that the final estimate is (given our input uncertainty) the result of many factors of medium effect. It does seem plausible that the output is somewhat less sensitive to these factors:
| Input | Type of uncertainty | Meaning/(un)importance |
|---|---|---|
| num yrs between deworming and benefits | Forecast | Affects how much discounting of future income streams must be done |
| duration of long-term benefits | Forecast | The length of time for a which a person works and earns income |
| expected value from leverage and funging | Game theoretic | How much does money donated to Deworm the World shift around other money |
Schistosomiasis Control Initiative
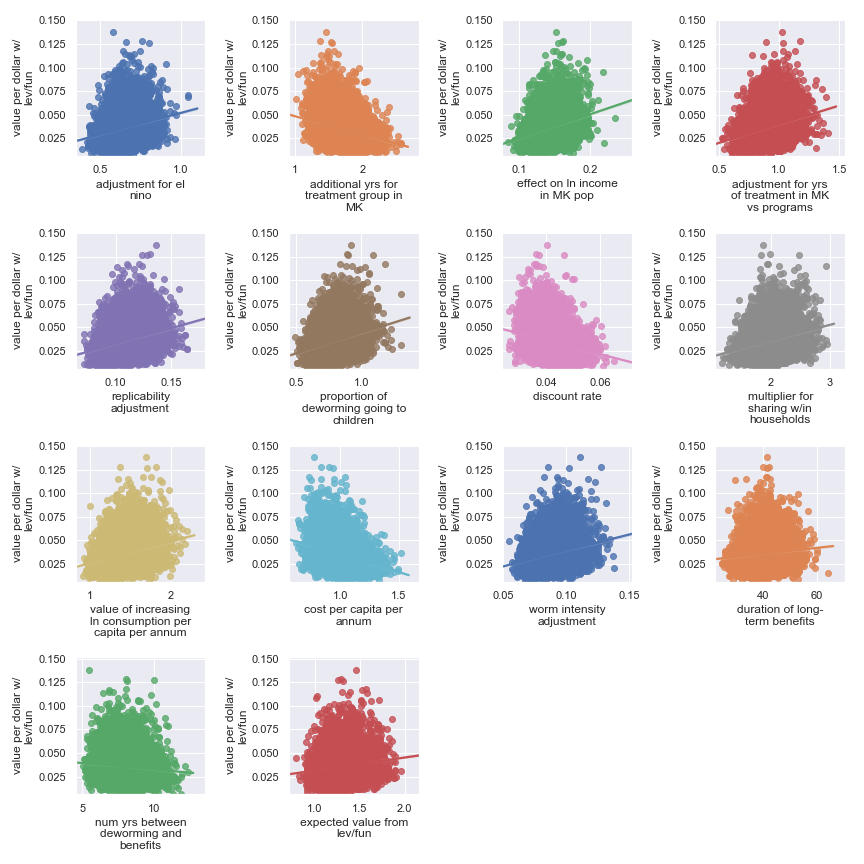
Again, it’s a little harder to identify certain factors as more important. It seems that the final estimate is (given our input uncertainty) the result of many factors of medium effect. It does seem plausible that the output is somewhat less sensitive to these factors:
| Input | Type of uncertainty | Meaning/(un)importance |
|---|---|---|
| num yrs between deworming and benefits | Forecast | Affects how much discounting of future income streams must be done |
| duration of long-term benefits | Forecast | The length of time for a which a person works and earns income |
| expected value from leverage and funging | Game theoretic | How much does money donated to Schistosomiasis Control Initiative shift around other money |
Sightsavers
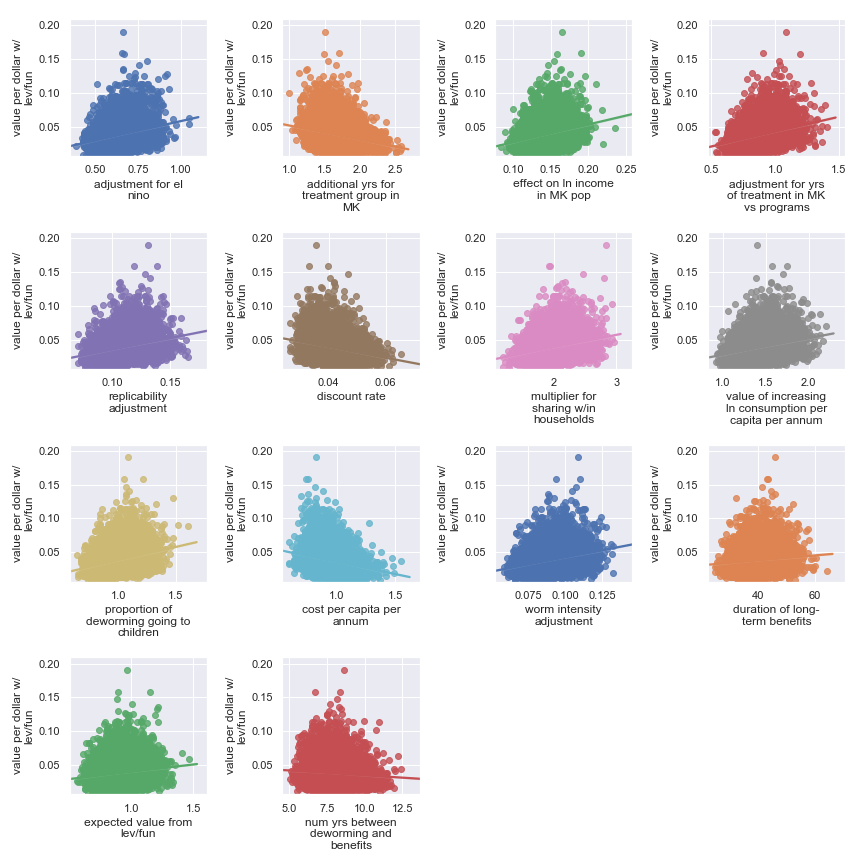
Again, it’s a little harder to identify certain factors as more important. It seems that the final estimate is (given our input uncertainty) the result of many factors of medium effect. It does seem plausible that the output is somewhat less sensitive to these factors:
| Input | Type of uncertainty | Meaning/(un)importance |
|---|---|---|
| num yrs between deworming and benefits | Forecast | Affects how much discounting of future income streams must be done |
| duration of long-term benefits | Forecast | The length of time for a which a person works and earns income |
| expected value from leverage and funging | Game theoretic | How much does money donated to Sightsavers shift around other money |
Seasonal malaria chemoprevention
Malaria Consortium
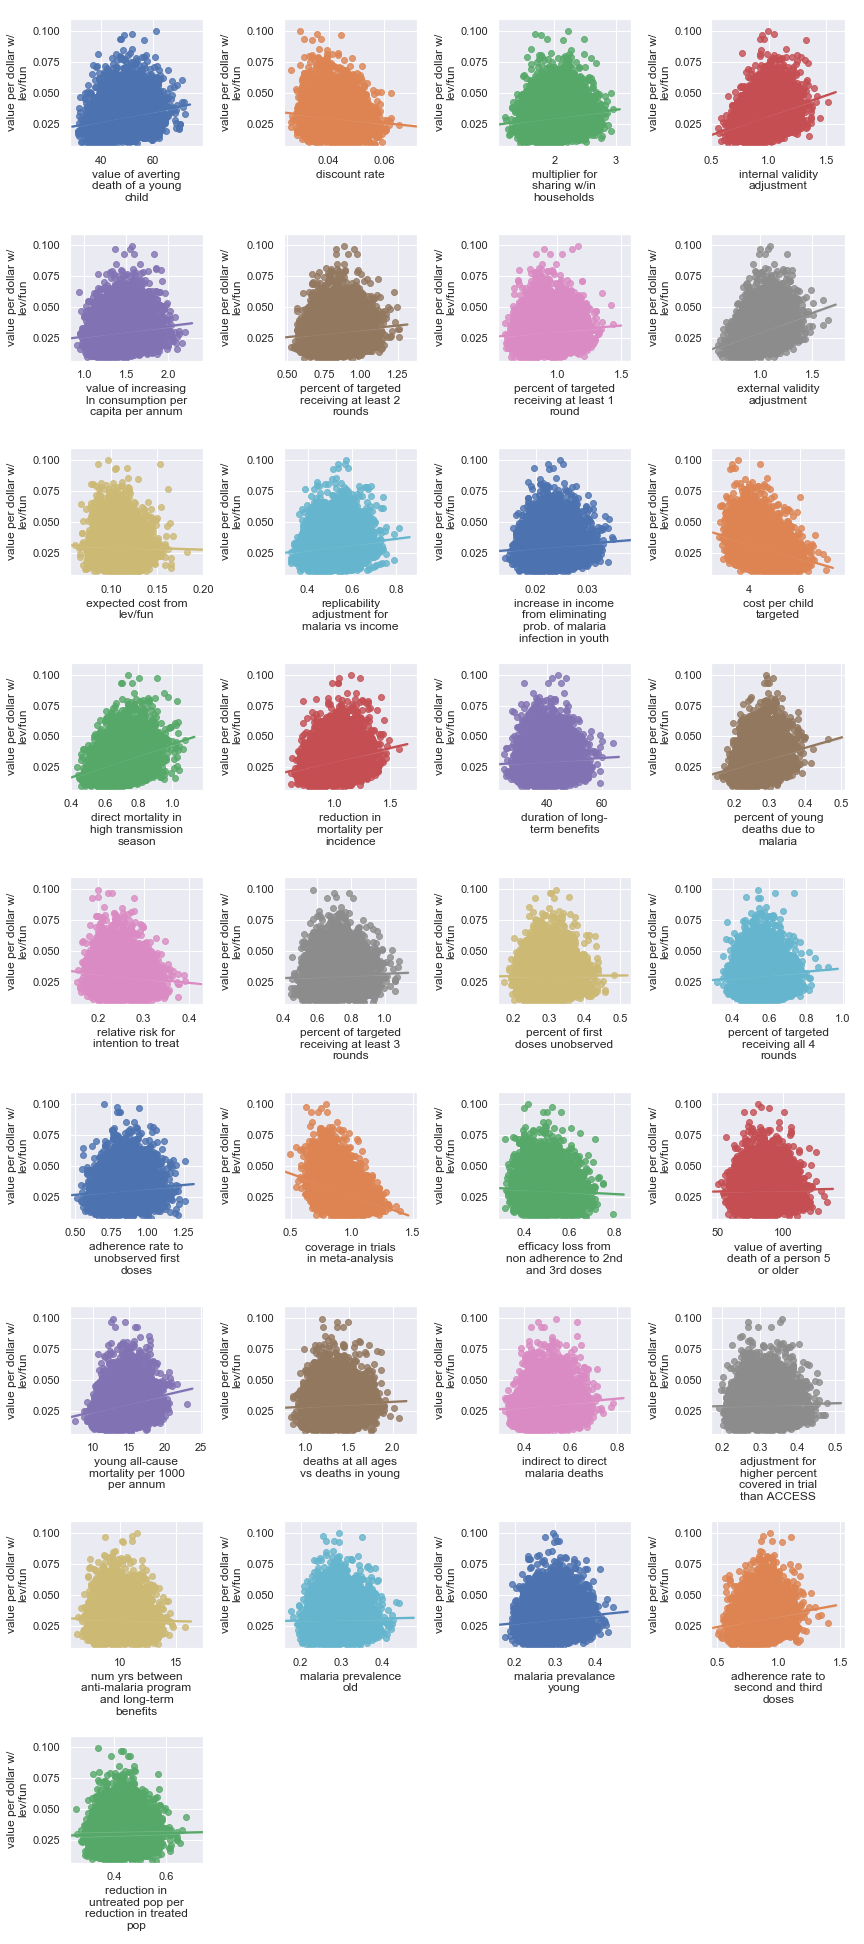
The scatter plots show that, given our choice of input uncertainty, the output is most sensitive (i.e. the scatter plot for these parameters shows the greatest directionality) to the input parameters:
| Input | Type of uncertainty | Meaning/importance |
|---|---|---|
| direct mortality in high transmission season | Empirical | Fraction of overall malaria mortality during the peak transmission season and amenable to SMC |
| internal validity adjustment | Methodological | How much do we trust the results of the underlying SMC studies |
| external validity adjustment | Methodological | How much do the results of the underlying SMC studies transfer to new settings |
| coverage in trials in meta-analysis | Historical/methodological | Determines how much coverage an SMC program needs to achieve to match studies |
| value of averting death of a young child | Moral | Determines final conversion between empirical outcomes and value |
| cost per child targeted | Operational | Affects cost of results |
Vitamin A supplementation
Helen Keller International
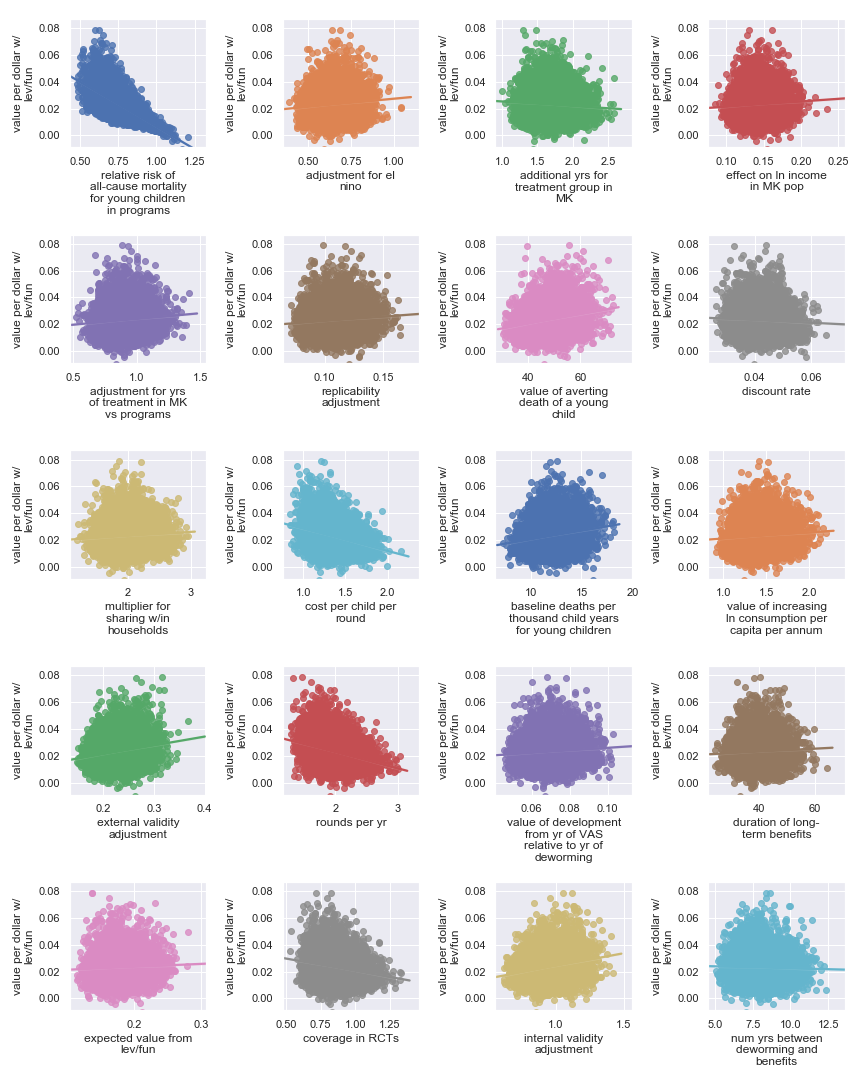
The scatter plots show that, given our choice of input uncertainty, the output is most sensitive to the input parameters:
| Input | Type of uncertainty | Meaning/importance |
|---|---|---|
| relative risk of all-cause mortality for young children in programs | Causal | How much do VAS programs affect mortality |
| cost per child per round | Operational | Affects cost of results |
| rounds per year | Operational | Affects cost of results |
Bednets
Against Malaria Foundation
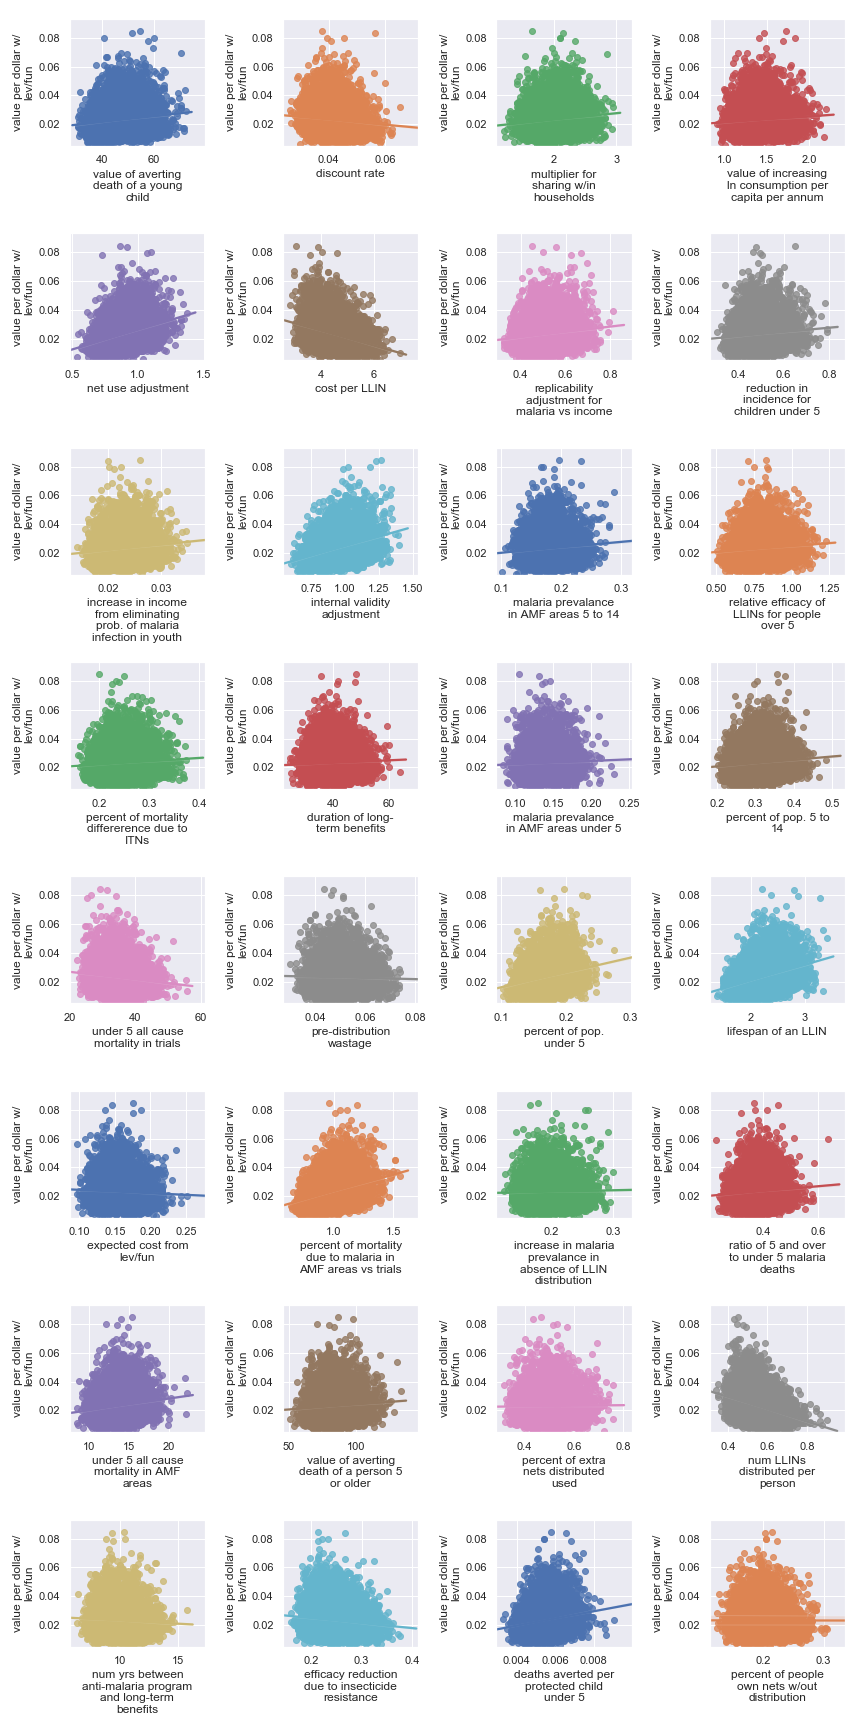
The scatter plots show that, given our choice of input uncertainty, the output is most sensitive (i.e. the scatter plot for these parameters shows the greatest directionality) to the input parameters:
| Input | Type of uncertainty | Meaning/importance |
|---|---|---|
| num LLINs distributed per person | Operational | Affects cost of results |
| cost per LLIN | Operational | Affects cost of results |
| deaths averted per protected child under 5 | Causal | How effective is the core activity |
| lifespan of an LLIN | Empirical | Determines how many years of benefit accrue to each distribution |
| net use adjustment | Empirical | Determines benefits from LLIN as mediated by proper and improper use |
| internal validity adjustment | Methodological | How much do we trust the results of the underlying studies |
| percent of mortality due to malaria in AMF areas vs trials | Empirical/historical | Affects size of the problem |
| percent of pop. under 5 | Empirical | Affects size of the problem |
Delta moment-independent sensitivity analysis
If eyeballing plots seems a bit unsatisfying to you as a method for judging sensitivity, not to worry. We also have the results of a more formal sensitivity analysis. This method is called delta moment-independent sensitivity analysis.
\(\delta_i\) (the delta moment-independent sensitivity indicator of parameter \(i\)) “represents the normalized expected shift in the distribution of [the output] provoked by [that input]” (Borgonovo 2007). To make this meaning more explicit, we’ll start with some notation/definitions. Let:
- \(X = (X_1, X_2, \ldots, X_n) \in \mathbb{R}^n\) be the random variables used as input parameters
- \(Y = f(X)\) so that \(f(X)\) is a function from \(\mathbb{R}^n\) to \(\mathbb{R}\) describing the relationship between inputs and outputs—i.e. GiveWell’s cost-effectiveness model
- \(f_Y(y)\) be the density function of the result \(Y\)—i.e. the probability distributions we’ve already seen showing the cost-effectiveness for each charity
- \(f_{Y|X_i}(y)\) be the conditional density of Y with one of the parameters \(X_i\) fixed—i.e. a probability distribution for the cost-effectiveness of a charity while pretending that we know one of the input values precisely
With these in place, we can define \(\delta_i\). It is:
\[\delta_i = \frac{1}{2} E_{X_i}[\int |f_Y(y) - f_{Y|X_i}(y)| \mathrm{d}y]\].
The inner \(\int |f_Y(y) - f_{Y|X_i}(y)| \mathrm{d}y\) can be interpreted as the total area between probability density function \(f_Y\) and probability density function \(f_{Y|X_i}\). This is the “shift in the distribution of \(Y\) provoked by \(X_i\)” we mentioned earlier. Overall, \(\delta_i\) then says:
- pick one value for \(X_i\) and measure the shift in the output distribution from the “default” output distribution
- do that for each possible \(X_i\) and take the expectation
Some useful properties to point out:
- \(\delta_i\) ranges from 0 to 1
- If the output is independent of the input, \(\delta_i\) for that input is 0
- The sum of \(\delta_i\) for each input considered separately isn’t necessarily 1 because there can be interaction effects
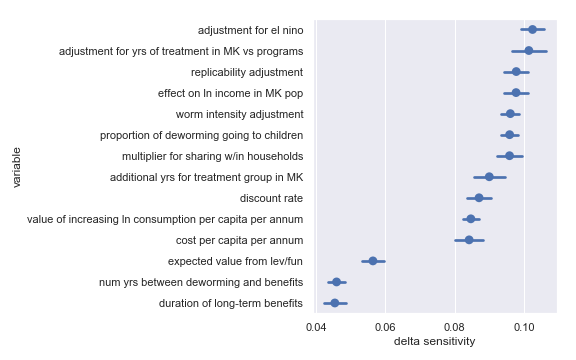
In the plots below, for each charity, we visualize the delta sensitivity (and our uncertainty about that sensitivity) for each input parameter.
Direct cash transfers
GiveDirectly
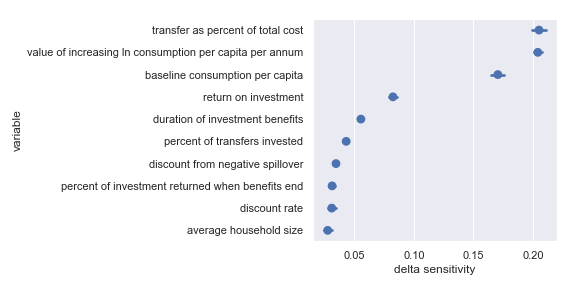
Comfortingly, this agrees with the results of our scatter plot sensitivity analysis. For convenience, I have copied the table from the scatter plot analysis describing the most influential inputs:
| Input | Type of uncertainty | Meaning/importance |
|---|---|---|
| value of increasing ln consumption per capita per annum | Moral | Determines final conversion between outcomes and value |
| transfer as percent of total cost | Operational | Affects cost of results |
| return on investment | Opportunities available to recipients | Determines stream of consumption over time |
| baseline consumption per capita | Empirical | Diminishing marginal returns to consumption mean that baseline consumption matters |
Deworming
The END Fund
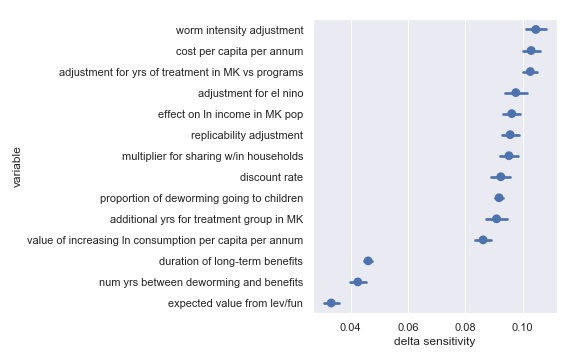
Comfortingly, this again agrees with the results of our scatter plot sensitivity analysis2. For convenience, I have copied the table from the scatter plot analysis describing the least influential inputs:
| Input | Type of uncertainty | Meaning/(un)importance |
|---|---|---|
| num yrs between deworming and benefits | Forecast | Affects how much discounting of future income streams must be done |
| duration of long-term benefits | Forecast | The length of time for a which a person works and earns income |
| expected value from leverage and funging | Game theoretic | How much does money donated to the END Fund shift around other money |
Deworm the World
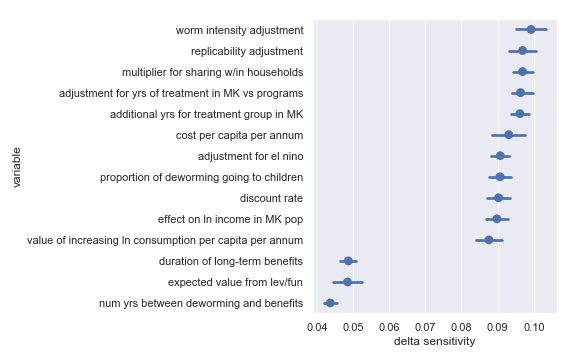
For convenience, I have copied the table from the scatter plot analysis describing the least influential inputs:
| Input | Type of uncertainty | Meaning/(un)importance |
|---|---|---|
| num yrs between deworming and benefits | Forecast | Affects how much discounting of future income streams must be done |
| duration of long-term benefits | Forecast | The length of time for a which a person works and earns income |
| expected value from leverage and funging | Game theoretic | How much does money donated to Deworm the World shift around other money |
Schistosomiasis Control Initiative
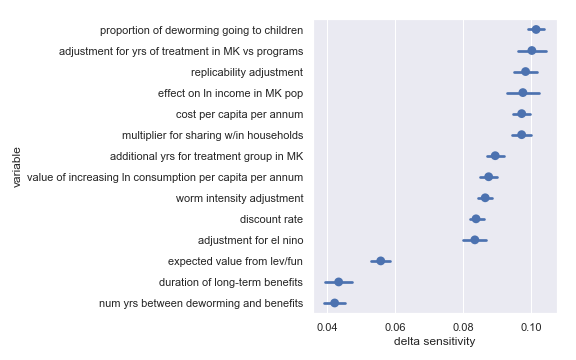
For convenience, I have copied the table from the scatter plot analysis describing the least influential inputs:
| Input | Type of uncertainty | Meaning/(un)importance |
|---|---|---|
| num yrs between deworming and benefits | Forecast | Affects how much discounting of future income streams must be done |
| duration of long-term benefits | Forecast | The length of time for a which a person works and earns income |
| expected value from leverage and funging | Game theoretic | How much does money donated to Schistosomiasis Control Initiative shift around other money |
Sightsavers
For convenience, I have copied the table from the scatter plot analysis describing the least influential inputs:
| Input | Type of uncertainty | Meaning/(un)importance |
|---|---|---|
| num yrs between deworming and benefits | Forecast | Affects how much discounting of future income streams must be done |
| duration of long-term benefits | Forecast | The length of time for a which a person works and earns income |
| expected value from leverage and funging | Game theoretic | How much does money donated to Sightsavers shift around other money |
Deworming comment
That we get substantially identical results in terms of delta sensitivities for each deworming charity is not surprising: The structure of each calculation is the same and (for the sake of not tainting the analysis with my idiosyncratic perspective) the uncertainty on each input parameter is the same.
Seasonal malaria chemoprevention
Malaria Consortium
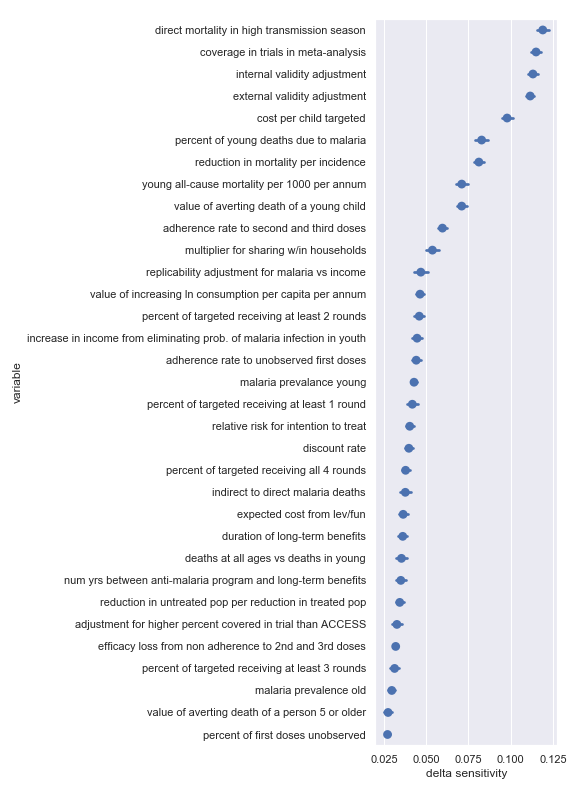
Again, there seems to be good agreement between the delta sensitivity analysis and the scatter plot sensitivity analysis though there is perhaps a bit of reordering in the top factor. For convenience, I have copied the table from the scatter plot analysis describing the most influential inputs:
| Input | Type of uncertainty | Meaning/importance |
|---|---|---|
| internal validity adjustment | Methodological | How much do we trust the results of the underlying SMC studies) |
| direct mortality in high transmission season | Empirical | Fraction of overall malaria mortality during the peak transmission season and amenable to SMC |
| cost per child targeted | Operational | Afffects cost of results |
| external validity adjustment | Methodological | How much do the results of the underlying SMC studies transfer to new settings |
| coverage in trials in meta-analysis | Historical/methodological | Determines how much coverage an SMC program needs to achieve to match studies |
| value of averting death of a young child | Moral | Determines final conversion between outcomes and value |
Vitamin A supplementation
Hellen Keller International
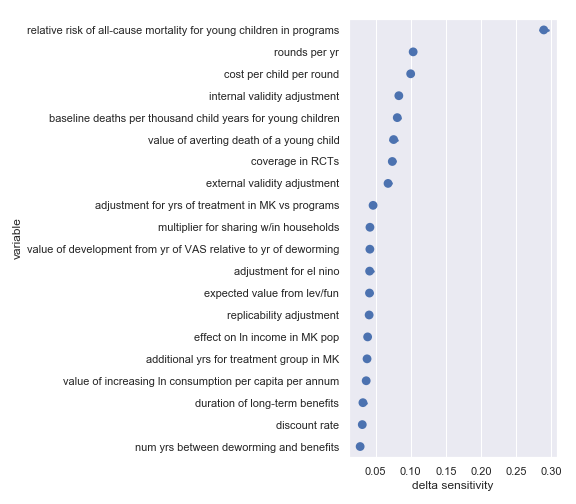
Again, there’s broad agreement between the scatter plot analysis and this one. This analysis perhaps makes the crucial importance of the relative risk of all-cause mortality for young children in VAS programs even more obvious. For convenience, I have copied the table from the scatter plot analysis describing the most influential inputs:
| Input | Type of uncertainty | Meaning/importance |
|---|---|---|
| relative risk of all-cause mortality for young children in programs | Causal | How much do VAS programs affect mortality |
| cost per child per round | Operational | Affects the total cost required to achieve effect |
| rounds per year | Operational | Affects the total cost required to achieve effect |
Bednets
Against Malaria Foundation
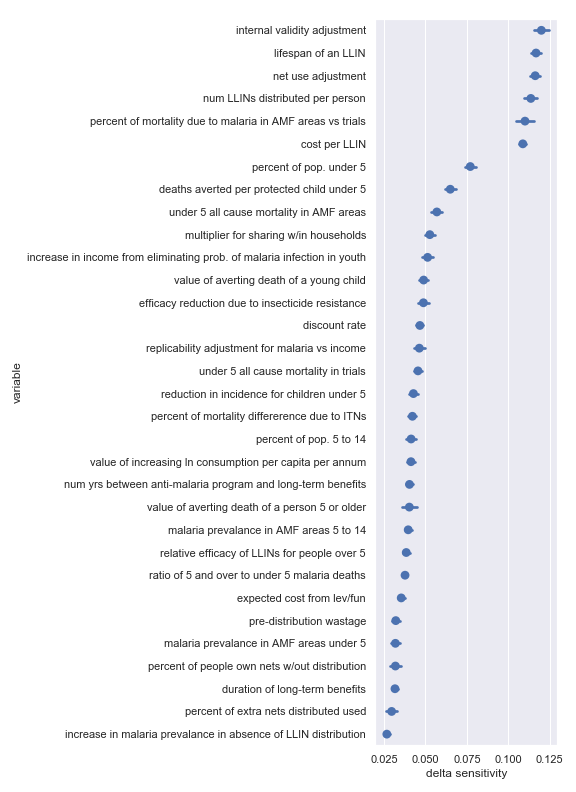
Again, there’s broad agreement between the scatter plot analysis and this one. For convenience, I have copied the table from the scatter plot analysis describing the most influential inputs:
| Input | Type of uncertainty | Meaning/importance |
|---|---|---|
| num LLINs distributed per person | Operational | Affects the total cost required to achieve effect |
| cost per LLIN | Operational | Affects the total cost required to achieve effect |
| deaths averted per protected child under 5 | Causal | How effective is the core activity |
| lifespan of an LLIN | Empirical | Determines how many years of benefit accrue to each distribution |
| net use adjustment | Empirical | Affects benefits from LLIN as mediated by proper and improper use |
| internal validity adjustment | Methodological | How much do we trust the results of the underlying studies |
| percent of mortality due to malaria in AMF areas vs trials | Empirical/historical | Affects size of the problem |
| percent of pop. under 5 | Empirical | Affects size of the problem |
Conclusion
We performed visual (scatter plot) sensitivity analyses and delta moment-independent sensitivity analyses on GiveWell’s top charities. Conveniently, these two methods generally agreed as to which input factors had the biggest influence on the output. For each charity, we found that there were clear differences in the sensitivity indicators for different inputs.
This suggests that certain inputs are better targets than others for uncertainty reduction. For example, the overall estimate of the cost-effectiveness of Helen Keller International’s vitamin A supplementation program depends much more on the relative risk of all-cause mortality for children in VAS programs than it does on the expected value from leverage and funging. If the cost of investigating each were the same, it would be better to spend time on the former.
An important caveat to remember is that these results still reflect my fairly arbitrary (but scrupulously neutral) decision to pretend that we equally uncertain about each input parameter. To remedy this flaw, head over to the Jupyter notebook and tweak the input distributions.
Appendix
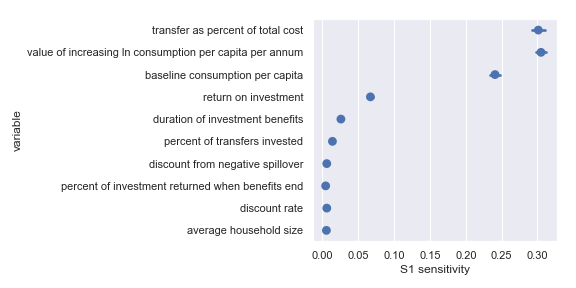
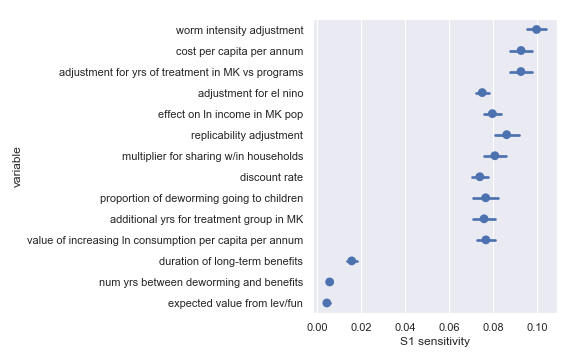
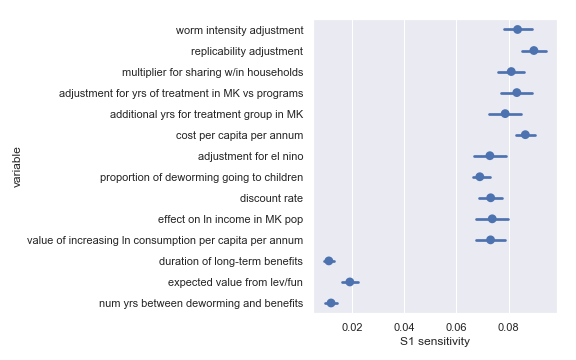
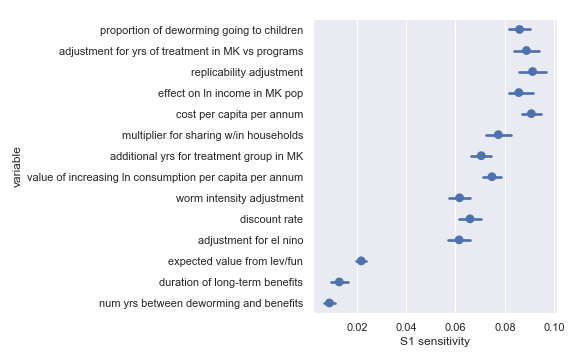
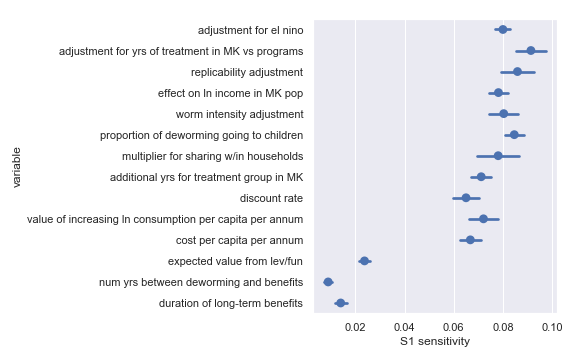
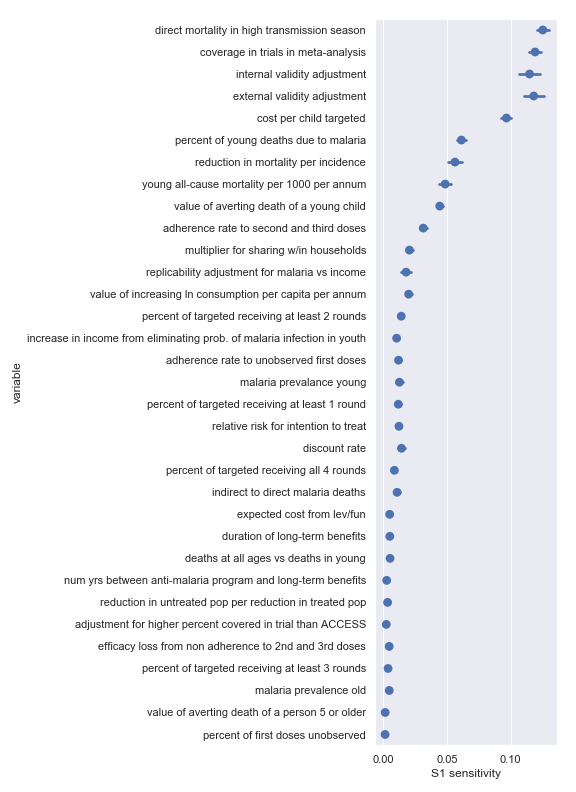
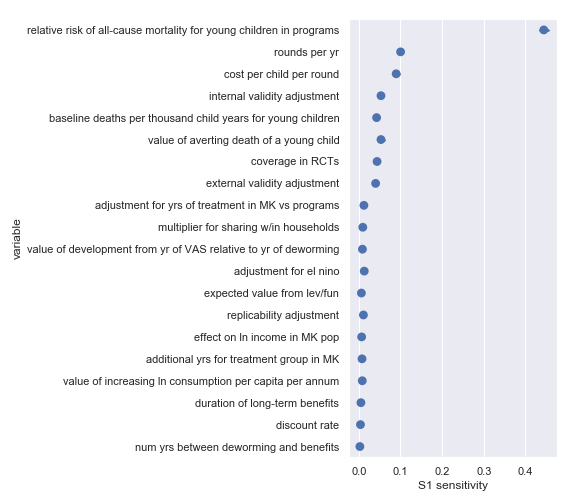
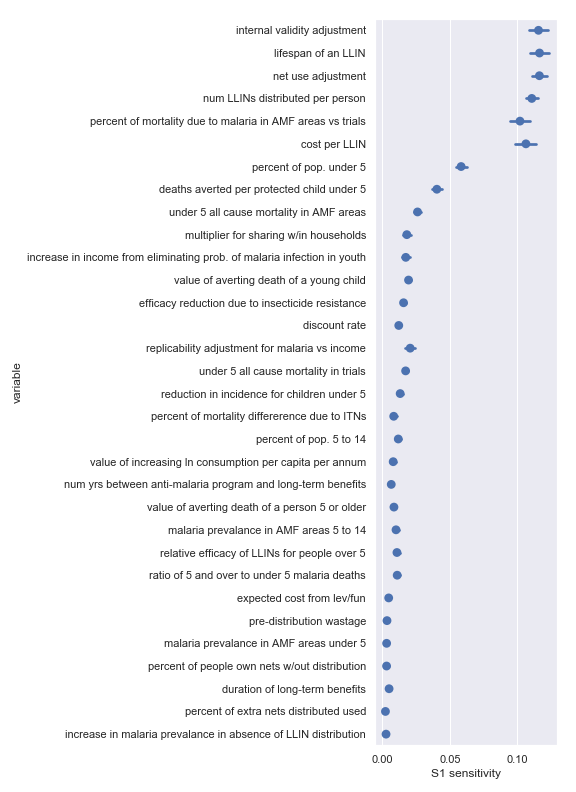
I also did a variance-based sensitivity analysis with Sobol indices. Those plots follow.
The variable order in each plot is from the input parameter with the highest \(\delta_i\) sensitivity to the input parameter with the lowest \(\delta_i\) sensitivity. That makes it straightforward to compare the ordering of sensitivities according to the delta moment-independent method and according to the Sobol method. We see that there is broad—but not perfect—agreement between the methods.
Borgonovo, Emanuele. 2007. “A New Uncertainty Importance Measure.” Reliability Engineering & System Safety 92 (6). Elsevier: 771–84. http://www.relialab.org/Upload/files/A%20new%20uncertainty%20importance%20measure.pdf.